Shining a Light on the Mystery Gold “Exports” from the UK
An administrative amendment by the U.K. Statistics Authority has caused a meaningless anomaly in their precious metals trade statistics for 2019.
Written by Jan Nieuwenhuijs, originally published at Voima Gold Insight.
Last week, an article titled “The Multibillion Mystery of the Great Gold Sale” was published by The Times. (If you don’t have access to The Times you can read it here.) The article was written by Ed Conway, who states that an extraordinary large load of gold bullion was exported from the U.K. in November and December 2019. A similar post by Conway (including several charts) can be found as a thread on Twitter.
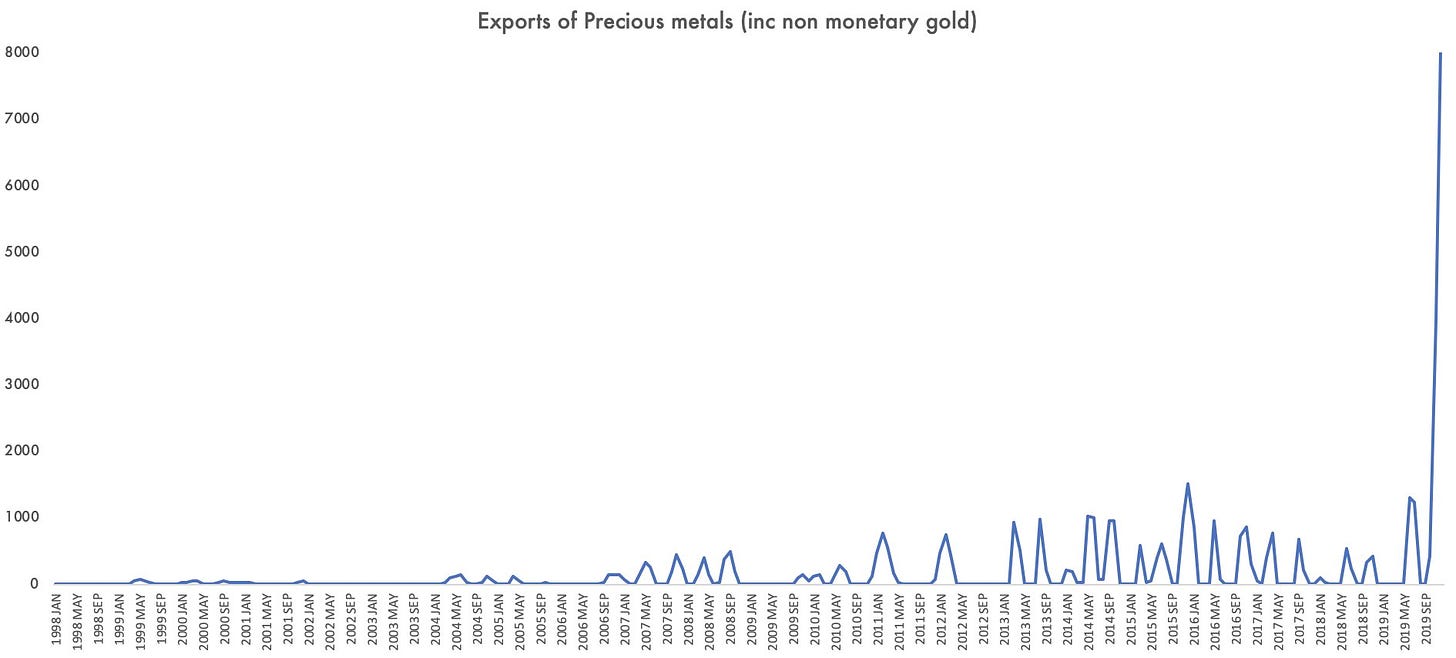
In The Times, Conway describes a hockey stick chart, reaching from January 1998 until December 2019, showing precious metals exports from the UK, with a massive spike at the very end. The chart he published on Twitter is copied below.

In my view, the data where the chart is based upon contains an error. I will share several arguments for my analysis. Because I often publish international gold trade statistics from the UK—and even write in-depth analyses about these statistics—I felt the need to share some essential information that puts Conway’s article in a proper perspective. So first, a brief primer on international trade statistics that will take away 99% of the confusion regarding this chart.
A Primer on International Trade Statistics
There are two types of international trade statistics. The first is a record of goods changing economic ownership, which is part of a country’s Balance Of Payments (BOP). A country’s BOP is subdivided in the current account and financial account, and goods fall in the former. BOP data of countries include the value of goods that change economic ownership between domestic and foreign residents. For example, if a UK resident sells a gold coin to a US resident, this is registered in the current account of the UK’s BOP as an export. The same transfer is registered in the current account of the US’ BOP as an import. However, for BOP data, it’s irrelevant where, in our example, the gold coin is located. BOP data strictly covers changes in economic ownership between residents of different countries.
The IMF sets the accounting rules for BOP data in their Balance of Payments and International Investment Position Manual (BPM6).
The second record for trade statistics is called International Merchandise Trade Statistics, and includes the value and (often) weight of goods crossing international borders irrespective of changes in economic ownership between residents of different countries. The accounting rules of these statistics are drafted by the UN, in the “International Merchandise Trade Statistics: Concepts and Definitions 2010” (IMTS 2010). IMTS data strictly covers the physical movements of goods. For example, a UK resident can ship a 400-ounce gold bar from London to Switzerland to have it refined in smaller kilobars, and this would show up as an export in the UK’s IMTS figures, although the gold doesn’t change economic ownership.
From IMTS 2010:
F.13. Non-monetary gold is recommended to be included in IMTS….
…the figures for imports and exports of “Total goods” in the BPM6 Goods and Services Account are expected, at least for some countries, to be significantly different from the figures for total imports and exports published in trade statistics [IMTS], probably often reflecting the role of goods for processing [i.e. refining gold] without change of ownership, transactions between related parties and merchanting in countries.…
In addition, figures published for non-monetary gold in the BPM6 Goods and Services Account may be very different from those published in IMTS because BPM6 includes and excludes transactions of non-monetary gold based on the residence of the buyer and seller.
In final, in the UK IMTS data is published by Her Majesty's Revenue and Customs (HMRC) and for the time being Eurostat. BOP data in the UK is published by the Office for National Statistics (ONS).
So, keep in mind, BOP data covers changes in ownership and IMTS data covers physical movements.
Illuminating the Mystery Multibillion Gold Exports
You might have guessed by now, that the figures used by Conway are different from the numbers I use for my analyses. Indeed, Conway has used BOP data for his column, and I always use IMTS data. Conway’s article has nothing to do with gold crossing the border of the UK. Cross-border trade numbers from the UK were published by me this week and revealed all but mysteries.
Let’s have a look at Conway’s hockey stick. First off, he only shows gross export of “precious metals” in his chart (we may assume 90% of the UK precious metals data refers to gold). If I add precious metals import for 2019, the picture changes drastically.

Conway’s hockey stick is the blue line. We can see that in 2019 significant imports at the beginning of the year were offset by significant exports in November and December, netting the year out, as shown by the gold-colored line (“PM Annual Accumulative Net Flow”).
Now we know the “mysterious great gold sales” (weighing about 300 tonnes) of late 2019, as reported by Conway, did not cross the UK border, and had close to zero impact on the annual balance. Let us proceed nonetheless.
(Conway mentions gold exports accounted for £4 billion in November and £8 billion in December 2019. What he doesn’t mention is that in January imports accounted for £3 billion, February £4 billion, March £4 billion, and April £2.5 billion.)
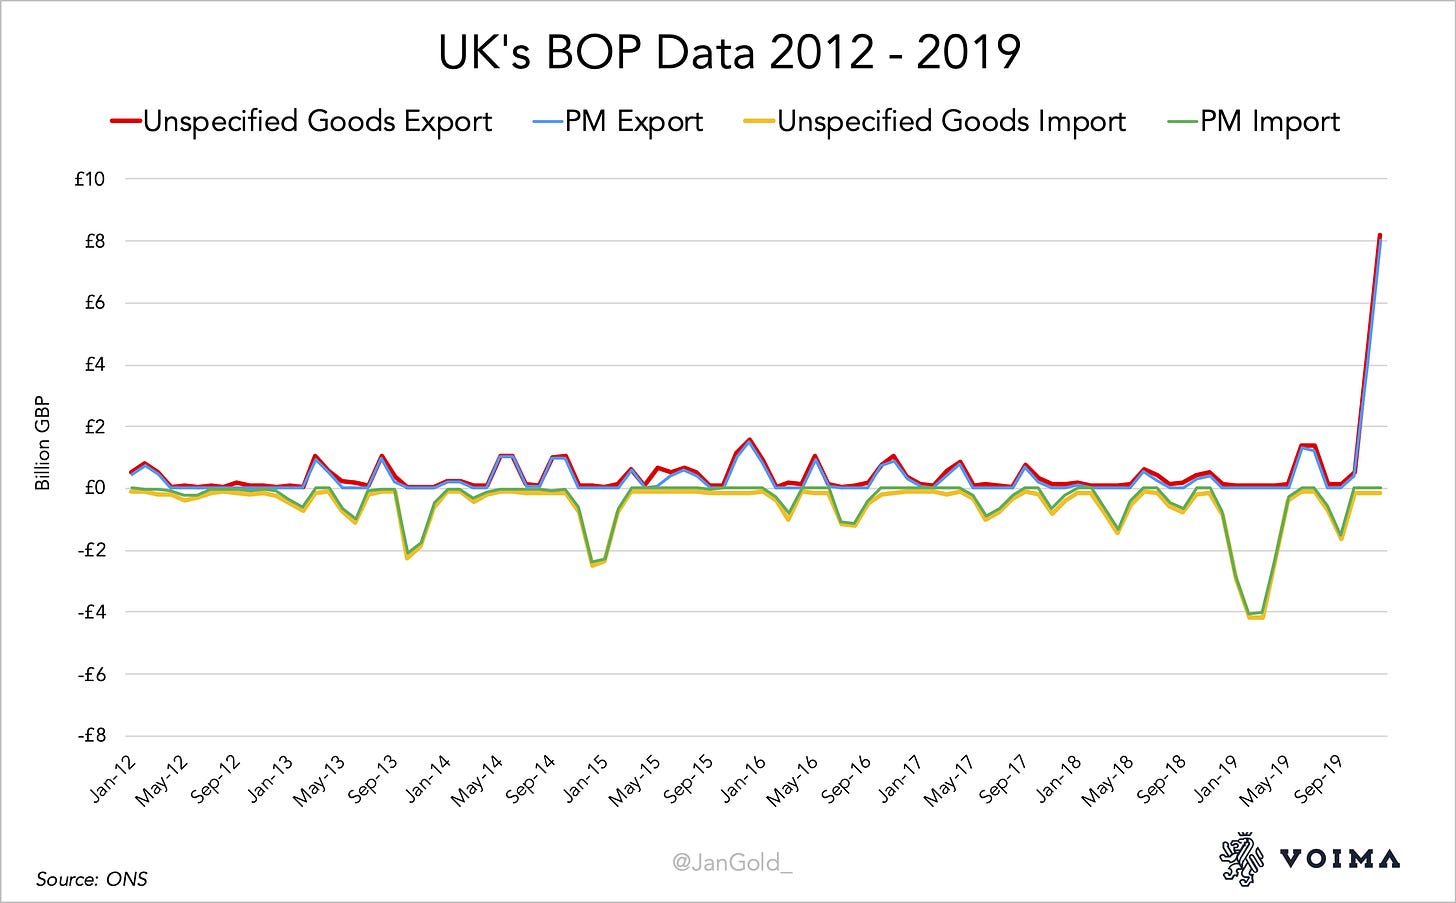
A commenter on Twitter caught my eye, because he showed that when gold export spiked late 2019, “unspecified goods” did as well. I have grabbed both data sets from the ONS website for comparison. I don’t know why, but the numbers are nearly an exact copy.
Let’s follow this lead by accepting precious metals, and unspecified goods are the same numbers.
The main difference in both data sets published by ONS, precious metals, and unspecified goods, is that the latter is broken down country-specific. So now we can have a look from who UK residents bought (import) gold early 2019, and sold to (export) late 2019. In the table below, you can see the biggest players.
From the countries listed, we, indeed, may assume this refers to gold dealings. The countries UK residents sold to were all well know gold buying nations and Switzerland, and the countries UK residents bought from were mostly gold mining nations and Switzerland. Remember, because we’re talking about BOP data, these trades can have physically been executed in the UK or anywhere else on the planet, for example, Switzerland. This data looks like if a UK resident, i.e., bullion bank, bought gold early 2019 from miners, and sold it to consumers while all this was taking place in Switzerland. Pure speculation.
So why were these 2019 deals published now, and not before?
Because London is a very liquid gold trading hub, “much of the effect of gold on trade is just the cumulative effect of trading decisions on the bullion exchanges [ONS].” This is why, Jonathan Athow, a statistician from ONS, published an article one day before Conway’s article, stating that ONS would exclude gold from BOP trade statistics. Strange huh?
Maybe ONS forgot to exclude gold trade from 2019, while they did exclude it from previous years? If we look at the first hockey stick chart by Conway, we see very little gross gold export from the UK from 1998 till 2018. This only makes sense if ONS has excluded most gross gold trades in those years. It’s certain London didn’t start trading massive amounts of gold in 2019—this started in the 17th century when Moses Mocatta moved from Amsterdam to London to establish the first member of the London gold market.
But why the great spikes in 2019? To me, it looks ONS made a mistake. But who knows?
In any case, I would like to stress that the article by Conway doesn’t contradict the numbers I publish on these pages. If any new information surfaces, I will keep you posted.


